
Directions:
- Open the App "Numbers"
- Create new spreadsheet
- Choose the template "Charting Basics"
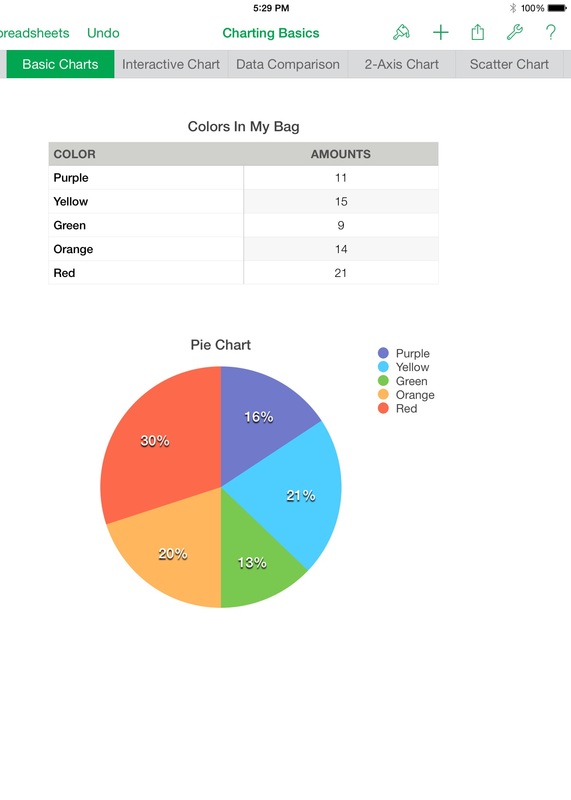
- Change the Title of the table to " Colors In My Bag"
- Change participant to "Color"
- Change units to "Amounts"
- Open your Skittles bag and count & complete your table
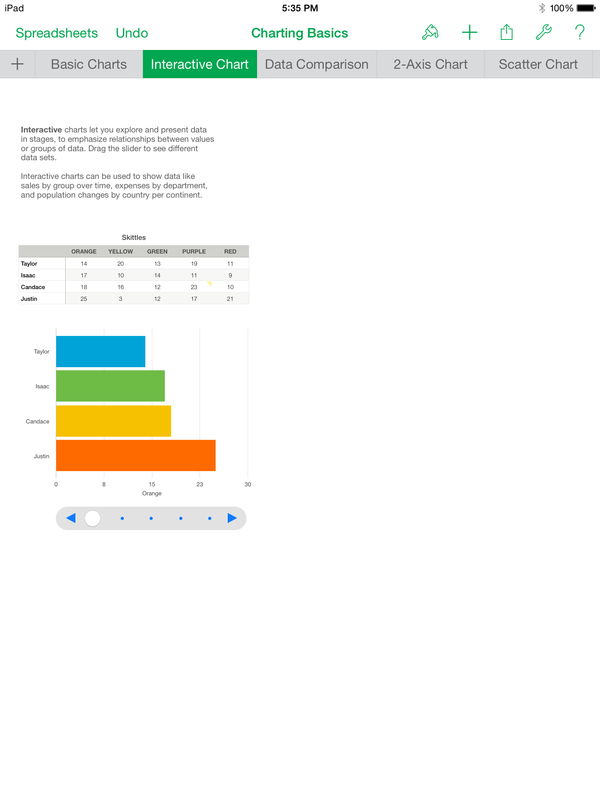
8 Click on Interactive Chart ( At top Navigation Chart)
9 Delete your current Interactive Chart ( Tap Once & Press Delete)
10 Change products to your name & 3 of your colleagues
11 Change the "Year" to the different colors
12 To Add a column: Press the the circle with two parallel lines, in the upper right corner of your table
9 Delete your current Interactive Chart ( Tap Once & Press Delete)
10 Change products to your name & 3 of your colleagues
11 Change the "Year" to the different colors
12 To Add a column: Press the the circle with two parallel lines, in the upper right corner of your table
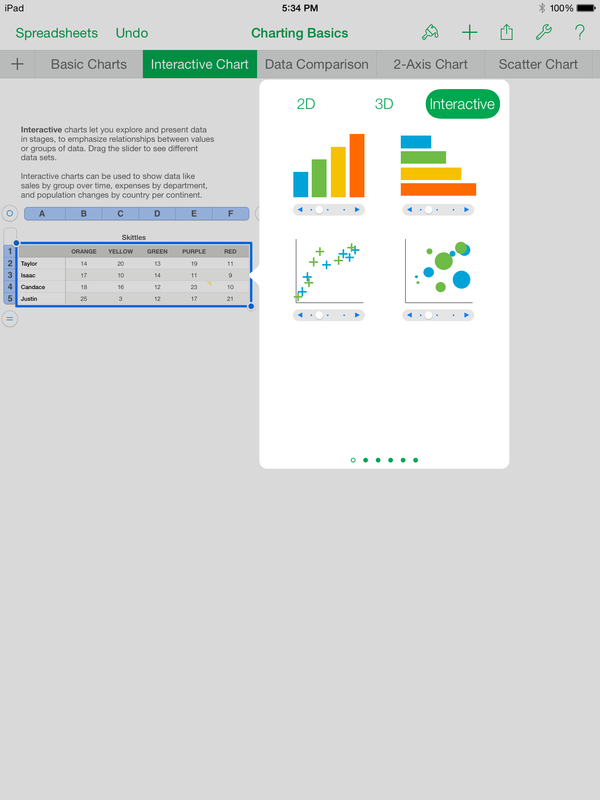
13 Starting in the upper left corner, tap lightly until you see a dark blue border, and drag it out the entirety of the table
14 Press "Create Chart", then select Interactive
14 Press "Create Chart", then select Interactive
15. Choose Bar Graph in any color
